
One common style for density plots is to have a vertical legend that is the same height as the plot itself. Some example density plots from Google Image search [1]:

How can we make DensityPlots [2] with legends whose height matches the height of the plot? By default the heights are different:
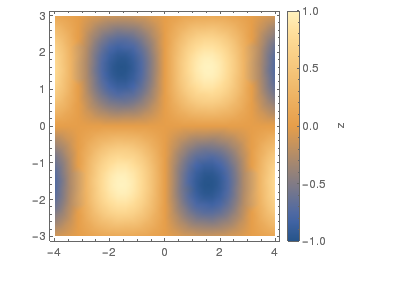
DensityPlot[Sin[x] Sin[y], {x, -4, 4}, {y, -3, 3},
 PlotLegends -> Automatic]

Elaborating a little on Sjoerd's answer:
Specifying LegendMargins makes it even clearer that the fancy new legend might be not as useful as I first thought. We now have a working legend but lost basically all control over its apearance:
DensityPlot[Sin[x] Sin[y], {x, -4, 4}, {y, -3, 3},
 ImageSize -> {300, 300},
 ImagePadding -> {{30, 30}, {30, 30}}, Background -> LightGray,
 PlotLegends ->
 BarLegend["LakeColors",
           LegendMargins -> {{10, 0}, {30, 20}},
           LegendFunction -> (Framed[#, FrameMargins -> 10] &)
           ]]

The upper edge of the BarLegend appears to allign roughly with the Plot canvas, but we now have the additional 30 points Margin at the top. Unfortunately if we change the Bottom Margin everything rescales:
DensityPlot[Sin[x] Sin[y], {x, -4, 4}, {y, -3, 3},
 ImageSize -> {300, 300},
 ImagePadding -> {{30, 30}, {30, 30}}, Background -> LightGray,
 PlotLegends ->
  BarLegend["LakeColors",
            LegendMargins -> {{10, 0}, {10, 20}},
            LegendFunction -> (Framed[#, FrameMargins -> 10] &)
           ]]

Again the Legend claims additional space above and below the Plot. Imagine the nightmare in a GraphicsGrid with different kinds of Plots. To me, it appears as if the chance of ever aligning to Plots (and their Legends) next to each other are basically zero.
Looking at the InputForm of the above Plot gives a huge expression with Head Legended:
Legended[ .......,
{Placed[BarLegend["LakeColors", LegendFunction -> (Framed[#1, FrameMargins -> 10] & ), LegendLayout -> "Column", LegendMargins -> {{10, 0}, {10, 20}}, LegendMarkerSize -> 300, Charting`TickSide -> Right, ColorFunctionScaling -> True, LegendMargins -> {{10, 0}, {10, 20}},
LegendFunction -> (Framed[#1, FrameMargins -> 10] & )] , After, Identity]}]
We note two things: first there is the use of LegendMarkerSize that appears to take the vertical ImageSize. Fiddling with it can improve the result a little:
DensityPlot[Sin[x] Sin[y], {x, -4, 4}, {y, -3, 3},
 ImageSize -> {300, 300},
 ImagePadding -> {{30, 30}, {30, 30}}, Background -> LightGray,
 PlotLegends ->
  BarLegend["LakeColors",
  LegendMargins -> {{10, 0}, {-10, -10}},
  LegendFunction -> (Framed[#, FrameMargins -> 10] &),
  LegendMarkerSize -> 300]
 ]
gives:

The second thing is the usage of ChartingTickSide -> Right`, which controls where the Ticks are written.
I tried to find where the Charting*` stuff is defined, but could only get the following large list of expressions:
Names["Charting`*"]

{"Charting'angleCalc", "Charting'angleToValue",
 "Charting'AngularScale", "Charting'apportion",
 "Charting'AutomaticBar", "Charting'AutomaticBar3D",
 "Charting'AutomaticBubble", "Charting'AutomaticBubble3D",
 "Charting'AutomaticSector", "Charting'AutomaticSector3D",
 "Charting'AutomaticTrap", "Charting'AxesLabelRotate",
 "Charting'AxisAnnotation", "Charting'AxisAppearance",
 "Charting'AxisFactor", "Charting'AxisLabel", "Charting'BackTesting",
 "Charting'barPointtoValue", "Charting'barValHeight",
 "Charting'barValueToPoint", "Charting'BoxElements",
 "Charting'BulletCheck", "Charting'canonicalPlotLegends",
 "Charting'canonicalWrapperLegends", "Charting'CanvasPadding",
 "Charting'CategoricalAxis", "Charting'CategoryBounds",
 "Charting'CategorySpacing", "Charting'ChartArgCheck",
 "Charting'ChartHighlighting", "Charting'ChartLegendsParser",
 "Charting'ChartParser", "Charting'ChartStyleBlock",
 "Charting'ChartStyleInformation", "Charting'checkChartElement",
 "Charting'checkColor", "Charting'checkGridLines",
 "Charting'ClickEffect", "Charting'ClockCheck",
 "Charting'colorfunctionScale", "Charting'CompleteSizes",
 "Charting'computeScenePlotRange", "Charting'computeSceneRange",
 "Charting'ConstructColorFunction", "Charting'ConstructDirective",
 "Charting'ConstructErrorBars", "Charting'constructLegends",
 "Charting'CoordinateListQ", "Charting'CoordinateQ",
 "Charting'createDefaultLabels", "Charting'createPlotRange",
 "Charting'createPlotRange3D", "Charting'dataExtremes",
 "Charting'DateAxis", "Charting'datedDataExtremes",
 "Charting'DateFormat", "Charting'DateScale", "Charting'DateScope",
 "Charting'DateValueParser", "Charting'dbPrint",
 "Charting'DefaultPlotStyle", "Charting'DisplayFunctionTest",
 "Charting'DivisionLabelingFunction", "Charting'drawLegendMarkers",
 "Charting'drawLegends", "Charting'drawMarkers",
 "Charting'drawMarkers3D", "Charting'DynamicAction",
 "Charting'DynamicImage", "Charting'edgeDirective",
 "Charting'emptyDataQ", "Charting'ErrorBar",
 "Charting'ErrorBarFunction", "Charting'ErrorBarSize",
 "Charting'ErrorBarStyle", "Charting'expandFilling",
 "Charting'expandPlaced", "Charting'expandPlotRange",
 "Charting'expandPlotRange3D", "Charting'extractLabels",
 "Charting'FilterGraphics3DOptions", "Charting'FilterGraphicsOptions",
 "Charting'FinancialIndicatorList",
 "Charting'FinancialIndicatorLists", "Charting'FinancialIndicators",
 "Charting'FinancialPattern", "Charting'findAxesOrigin",
 "Charting'FindGrid", "Charting'findPlotRange", "Charting'FindTicks",
 "Charting'FindTicksP", "Charting'gaugeBoxes", "Charting'GaugeCheck",
 "Charting'generalDirective",
 "Charting'generateLegendDynamicVariable", "Charting'generateLegends",
 "Charting'get2DPlotRange", "Charting'get3DPlotRange",
 "Charting'getBasicStyles", "Charting'getBasicStyles2",
 "Charting'getDataExtremes", "Charting'getExtremes",
 "Charting'GetGraphicsOptions", "Charting'getPlotStyles",
 "Charting'getQuantityLabel", "Charting'getSideMarker",
 "Charting'getTargetUnits", "Charting'getTrendStyle",
 "Charting'gridlinesFinder", "Charting'HeldOptionQ",
 "Charting'Highlighted", "Charting'HistArgCheck",
 "Charting'HorizontalScale", "Charting'iBarChart",
 "Charting'iBarChart3D", "Charting'iBarLegend",
 "Charting'iBoxWhiskerChart", "Charting'iBubbleChart",
 "Charting'iBubbleChart3D", "Charting'iCandlestickChart",
 "Charting'iDensityHistogram", "Charting'iDialGauge",
 "Charting'iDistributionChart", "Charting'iFinancialIndicatorLists",
 "Charting'iHistogram", "Charting'iHistogram3D",
 "Charting'iHistogramList", "Charting'iInteractiveTradingChart",
 "Charting'iKagiChart", "Charting'iLegended", "Charting'iLinearGauge",
 "Charting'iLineBreakChart", "Charting'iLineLegend",
 "Charting'IndicatorFunction", "Charting'Indicators",
 "Charting'interactiveTradingChartActionMenu",
 "Charting'interactiveTradingChartResetButton",
 "Charting'interactiveTradingChartSnapshotButton",
 "Charting'iPairedBarChart", "Charting'iPairedHistogram",
 "Charting'iPointFigureChart", "Charting'iPointLegend",
 "Charting'iRenkoChart", "Charting'iSectorChart",
 "Charting'iSectorChart3D", "Charting'iSwatchLegend",
 "Charting'iTradingChart", "Charting'LabelSide", "Charting'Legend",
 "Charting'LegendCanvas", "Charting'LegendConstructer",
 "Charting'legendize", "Charting'LegendSize",
 "Charting'LegendWrapper", "Charting'listDepthCount",
 "Charting'ListScale", "Charting'lookUpIndicators",
 "Charting'mainChart", "Charting'makeDynamicModule",
 "Charting'makeGaugeBoxes", "Charting'MemoryLeakTest",
 "Charting'MouseEffect", "Charting'nearestDate", "Charting'negativeQ",
 "Charting'nonNegativeQ", "Charting'noShow", "Charting'Nothing",
 "Charting'OHLC", "Charting'OHLCV", "Charting'optCheck",
 "Charting'padChartElements", "Charting'PadLabels",
 "Charting'padList", "Charting'padMarkerStyle",
 "Charting'padMarkerStyle2", "Charting'padMarkerStyle3",
 "Charting'PairedCategoryAxis", "Charting'PairedChartArgCheck",
 "Charting'PairedHistArgCheck", "Charting'ParametricScale",
 "Charting'parseBulletChart", "Charting'parseChartElements",
 "Charting'parseChartElementsRow", "Charting'parseChartLabels",
 "Charting'parseChartLabelsRow", "Charting'parseChartLegends",
 "Charting'parseChartLegends2", "Charting'parseClock",
 "Charting'parseLabelingFunction", "Charting'parseLegendPlotStyle",
 "Charting'parsePlotMarkers", "Charting'parsePlotMarkers3D",
 "Charting'parseThermometer", "Charting'PatternsFunction",
 "Charting'PFLP", "Charting'PictorialBar", "Charting'PictorialBar3D",
 "Charting'PictorialBubble", "Charting'PictorialBubble3D",
 "Charting'PictorialTrap", "Charting'PlainAutomaticBar3D",
 "Charting'PlotArgCheck", "Charting'PlotOrigin",
 "Charting'PlotParser", "Charting'PlotTheme",
 "Charting'polarMarkerLabeling", "Charting'polarMarkerLabeling3D",
 "Charting'polygonDirective", "Charting'positiveQ",
 "Charting'PruneOptions", "Charting'RadialScale",
 "Charting'RangeBarChart", "Charting'realNumericQ",
 "Charting'RenderAssembler", "Charting'RenderMarker",
 "Charting'RenderMouseEffect", "Charting'rescale",
 "Charting'resetAngle", "Charting'resolveHighlighting",
 "Charting'resolveLabeled", "Charting'resolveLabeledDynamic",
 "Charting'resolveLabeledStatic", "Charting'resolveLabelingFunction",
 "Charting'resolveLabelingFunctionDynamic",
 "Charting'resolveLabelingFunctionStatic",
 "Charting'resolveMarkerLabeling", "Charting'resolvePlaced",
 "Charting'resolvePlacedDynamic", "Charting'resolvePlacedStatic",
 "Charting'resolvePlotRangePadding", "Charting'ResolvePlotTheme",
 "Charting'RotateLabels", "Charting'RotateTicks", "Charting's",
 "Charting'safeColor", "Charting'ScaleAxes", "Charting'ScaleAxis",
 "Charting'ScaleAxis3D", "Charting'ScaledFrameTicks",
 "Charting'ScaledTicks", "Charting'ScaledTicks2",
 "Charting'ScaledTickValues", "Charting'scaledValues",
 "Charting'scientificForm", "Charting'SetChartStyleInformation",
 "Charting'SimplePadding", "Charting'StudiesFunction",
 "Charting'styleTree", "Charting's$", "Charting'TickAnnotations",
 "Charting'TickLabels", "Charting'TickLengths",
 "Charting'TickMarkers", "Charting'TickSide", "Charting'TickWrappers",
 "Charting'TimeAxis", "Charting'TimelineParser", "Charting'TimeScale",
 "Charting'tradingChartGridlinesFinder",
 "Charting'TradingChartIndicator", "Charting'TradingChartSlider",
 "Charting'Tukey5", "Charting'Tweaked", "Charting'unitConverting",
 "Charting'UnsetChartStyleInformation", "Charting'value2pts",
 "Charting'valueToAngle", "Charting'varCheck",
 "Charting'VerticalScale", "Charting'$Graphics3DExtraOptions",
 "Charting'$GraphicsExtraOptions", "Charting'$MajorTickLength",
 "Charting'$MinorTickLength", "Charting'$PlotTheme",
 "Charting'$PlotThemes"}
So maybe there is some chance left to regain control over our plots. However, this is beyond me. Please, could somebody explain to me the reasoning behind the new Legended functionality and the Layout? What were they thinking??
If you provide BarLegend as an explicit option value of PlotLegends it seems to do what you want:
DensityPlot[Sin[x] Sin[y], {x, -4, 4}, {y, -3, 3},
 ImageSize -> {300, 300}, PlotLegends -> BarLegend["LakeColors"]]

Barlegend is not the key. ImageSize is the key that must be explicitly set ! It seems that BarLegends needs ImageSize to pick up LegendMarkerSize. Check DensityPlot[Sin[x] Sin[y], {x, -4, 4}, {y, -3, 3}, ImageSize -> Medium, PlotLegends -> Automatic] - matheorem
ImageSize is very often the answer when plots look bad, especially after exporting... but I guess we'll still have to wait for version 18 after all. - Jens
This makes me happy. Still a usage case for ye-olde-colorbarplot package :) I've not checked if it works in v9 though!
http://www.walkingrandomly.com/?p=2960

Hope this workaround helps.
Use Placed to position legends more precisely:
DensityPlot[Sin[x] Sin[y], {x, -4, 4}, {y, -3, 3},
 PlotLegends ->
  Placed[BarLegend[Automatic, LegendMarkerSize -> 280], {1.05, 0.52}]]

{1.05, 0.52} is a scaled position referred to the DensityPlot.
The offset here, 0.52 instead of 0.5, is because frame tick labels move the plot off center. The same reasoning applies to the BarLegend itself sometimes because the tick labels can move the gradient off center (this example is lucky to have symmetric labels on both ends).
LegendMarkerSize->280 is because the DensityPlot has some plot range padding that needs compensation.
0.02 offset, the 1.05and the 280)? - Ronny
PlotLegends and guessed them, too; though they are quite different for my ArrayPlot (that does not have Padding for example). - Ronny
There is a way to combine the already suggested old style Row arrangement (see
here
[1]) automatically with the new and convenient BarLegend using these conversion function:
(* Function to generate the color bar legend *)

customBarLegend[zmin_, zmax_, label_, colorFunction_: Automatic,
  colorFunctionScaling_: True] := Module[{},
  Show[ArrayPlot[
    Table[{zmax + zmin - y}, {y, zmin, zmax, (zmax - zmin)/100}],
    ColorFunction -> colorFunction,
    ColorFunctionScaling -> colorFunctionScaling,
    DataRange -> {{0, 1}, {zmin, zmax}},
    Frame -> True,
    FrameLabel -> {{None, None}, {None, label}},
    FrameTicks -> {{None, All}, {None, None}},
    PlotRangePadding -> 0,
    AspectRatio -> 20,
    Axes -> False],
   PlotRange -> {{0, 1}, {zmin, zmax}}]]

(* Function to convert a regular (ugly) BarLegend into a custom bar
legend that has the same height as the plot. *)

convertBarLegend[plot_, imPad_, barPad_, size_] :=
 Module[{zmin, zmax, zlabel, colorFunction, colorFunctionScaling, bar},
  {zmin, zmax} = (List @@ (List @@ plot)[[2]][[1]])[[1]][[2]];
  zlabel = LegendLabel /. (List @@ (List @@ plot)[[2]][[1]])[[3]];
  colorFunction = (List @@ (List @@ plot)[[2]][[1]])[[1]][[1]];
  colorFunctionScaling =
   ColorFunctionScaling /. (List @@ (List @@ plot)[[2]][[1]])[[6]];
  bar = customBarLegend[zmin, zmax, zlabel, colorFunction,
    colorFunctionScaling];
  Row[{Show[(List @@ plot)[[1]], ImageSize -> {Automatic, size},
     ImagePadding -> imPad],
    Show[bar, ImageSize -> {Automatic, size}, ImagePadding -> barPad]}]
  ]
Example:
uglyplot =
 DensityPlot[Sin[x] Sin[y], {x, -4, 4}, {y, -3, 3},
  PlotLegends -> BarLegend[Automatic, LegendLabel -> "z"]]

imPad = {{50, 7}, {60, 10}}; (*{{left,right},{bottom,top}}*)
barPad = {{1, 100}, imPad[[2]]};(* bottom and top should be the same as imPad. *)
plot = convertBarLegend[uglyplot, imPad, barPad, 300]
The numbers in imPad and barPad need to be adjusted to fit the size of the tick labels and the axes/frame labels. Therefore, they depend on the actual labels. The last parameter size determines how large the image is rendered.
In the functions, I make use of the fact that List@@plot gives access to a large variety of parameters that characterize the plot, such as ranges and labels.
Edit:
Changed the rendering of the custom bar legend from DensityPlot to ArrayPlot. This reduces the computation time and the file size of the graphics if exported to disk. Similarly, it is recommended to use ArrayPlot for the main graphics. See
here
[2] for an example.
New solution 2025-2-28
Previous version is not working anymore.
I use GraphicsInformation by Carl Woll
here
[1] and convert legend to graphics from
Kuba
[2] to new simpler sameHeightLegends function. Tested on Mathematica 14.2
ClearAll[convertLegendToGraphics];
convertLegendToGraphics[legend_] :=
 First@Cases[ToBoxes@legend,
   gr_GraphicsBox :> ToExpression[gr], \[Infinity]]

ClearAll[sameHeightLegends];
sameHeightLegends[plot_, imageHeight_:400] :=
 Module[{plotPart, plotPartNoLabel, legendPart, plotPadding,
   plotNoLabelPadding, legendPadding},
  plotPart = plot[[1]];
  plotPartNoLabel = DeleteCases[plotPart, PlotLabel -> _, Infinity];
  legendPart = convertLegendToGraphics@plot[[2, 1]];
  plotPadding =
   Association[GraphicsInformation[plotPart]]["ImagePadding"];
  plotNoLabelPadding =
   Association[GraphicsInformation[plotPartNoLabel]]["ImagePadding"];
  legendPadding =
   Association[GraphicsInformation[legendPart]]["ImagePadding"];
  Row[
   {
    Show[plotPart,
     ImagePadding -> {plotPadding[[1]], {plotPadding[[2, 1]],
        plotNoLabelPadding[[2, 2]]}},
     ImageSize -> {Automatic, imageHeight}],
    Show[legendPart,
     ImagePadding -> {legendPadding[[1]], plotPadding[[2]]},
     ImageSize -> {Automatic, imageHeight}]}]
  ]
test:
p1 = DensityPlot[Sin[x] Sin[y], {x, -4, 4}, {y, -3, 3},
   PlotLegends -> Automatic];
sameHeightLegends@p1

p2 = DensityPlot[x, {x, 0, 1}, {y, 0, 1},
   PlotLabel -> Style[Column[{"line1", "line2"}], 30, Red],
   BaseStyle -> Directive[Bold, 24], FrameLabel -> {"x", "y"},
   LabelStyle -> Green, PlotLegends -> Automatic];
sameHeightLegends@p2

Obselete
Here is my attempt to solve it as a post-processing way.
I will use two tools as bridges
The basic idea is stated quite clearly in Szabolcs's answer [5] for frame plots.
So first is define convertLegendToGraphics, it converts legend to Graphics object.
ClearAll[convertLegendToGraphics];
convertLegendToGraphics[legend_] :=
 First@Cases[ToBoxes@legend,
   gr_GraphicsBox :> ToExpression[gr], \[Infinity]]
Then define getPadding
ClearAll[getPadding];
getPadding[g_] := Module[{im},
   labelStyleOpt = Options[g, LabelStyle][[1, 2]];
   im = Image[
     Show[g /. _?ColorQ -> White,
      LabelStyle -> Directive[labelStyleOpt, White],
      Background -> White]];
   BorderDimensions[im] + {{0, 1}, {1, 0}}];
Note that I do a little tweak here which I found is necessary if your plot has specified custom LabelStyle or Styled PlotLabel. The _?ColorQ -> White has the ability to turn any explicit colored things into white including explicitly colored PlotLabel. However, it will have an disadvantage, it make getPadding only works for black frame or axis, so do not set fancy colored frame or axis.
then, finally the main part
ClearAll[sameHeightLegends];
sameHeightLegends[plot_] := Module[{},
  plotPart = plot[[1]];
  plotLabelOpt = Options[plotPart, PlotLabel][[1, 2]];
  imageSize = ImageDimensions[plotPart];
  verticalImageSize = imageSize[[2]];
  legendPart =
   Show[convertLegendToGraphics@plot[[2, 1]],
    ImageSize -> {Automatic, verticalImageSize}];

  {ph, pv} = getPadding[plotPart];
  {phNoLabel, pvNoLabel} =
   getPadding[Show[plotPart, PlotLabel -> None]];
  {lh, lv} = getPadding[legendPart /. _?ColorQ -> White];
  verticalPadding = pv;
  If[plotLabelOpt === None,
   Row[{Show[plotPart, ImageSize -> imageSize,
      ImagePadding -> {ph, verticalPadding}],
     Show[legendPart, ImagePadding -> {lh, verticalPadding}]}],
   Row[{Show[plotPart, ImageSize -> imageSize,
      ImagePadding -> {phNoLabel, pvNoLabel}],
     Show[legendPart, ImagePadding -> {lh, verticalPadding}]}]]]
note that I treat labeled case separately.
Ok, here is an example which I found probably no other solutions can done it right.
plot = DensityPlot[x, {x, 0, 1}, {y, 0, 1},
  PlotLabel -> Style[Column[{"line1", "line2"}], 30, Red],
  BaseStyle -> Directive[Bold, 24],
  FrameLabel -> {"x", "y"}, LabelStyle -> Green,
  PlotLegends -> Automatic]
it will give

and
sameHeightLegends[plot]
gives

ps
This method doesn't need to set ImageSize explictly and no special treatment to
PlotLegends, so is full automatic.
But of course, it only supports vertical Legends.
Currently, this post-processing method has one drawback. To retrieve absolute dimension of Plot or absolute ImagePadding, we need rasterization, and every rasterization takes about 0.3 seconds on my computer, so it has some efficiency problem. Nevertheless, for most case, it is bearable. Hope there is some faster way to get absolute imagesize and imagepadding.
[1] https://mathematica.stackexchange.com/a/138907/4742In the featured example on changing legend orientations [1], they use the following:
PlotLegends -> Placed[BarLegend[Automatic, LegendLayout -> "Column"], After]
This appears to produce legends that align as wanted if accompanied by an explicit ImageSize. It still produces a slight vertical offset as in Sjoerd's answer.
As a side note, the four-plot combination on the same page is far from perfect because of the other misalignments.
[1] http://reference.wolfram.com/mathematica/example/ChangeLegendOrientation.htmlImageSize -> 300 for the Plot will (why ever) do the Job on my PC (in contrary to @Sjoerd C.s answer), if I use only one Value and set the PlotRangePadding -> 0 - Ronny